
Incident, injury, and claims data hold valuable lessons—but only if you can quickly uncover the trends inside them. With SoterAI’s Analyze Incident Trends workflow, you can upload data files and instantly generate clear reports, charts, and insights to guide your next actions.
How to Use the Analyze Incident Trends Workflow
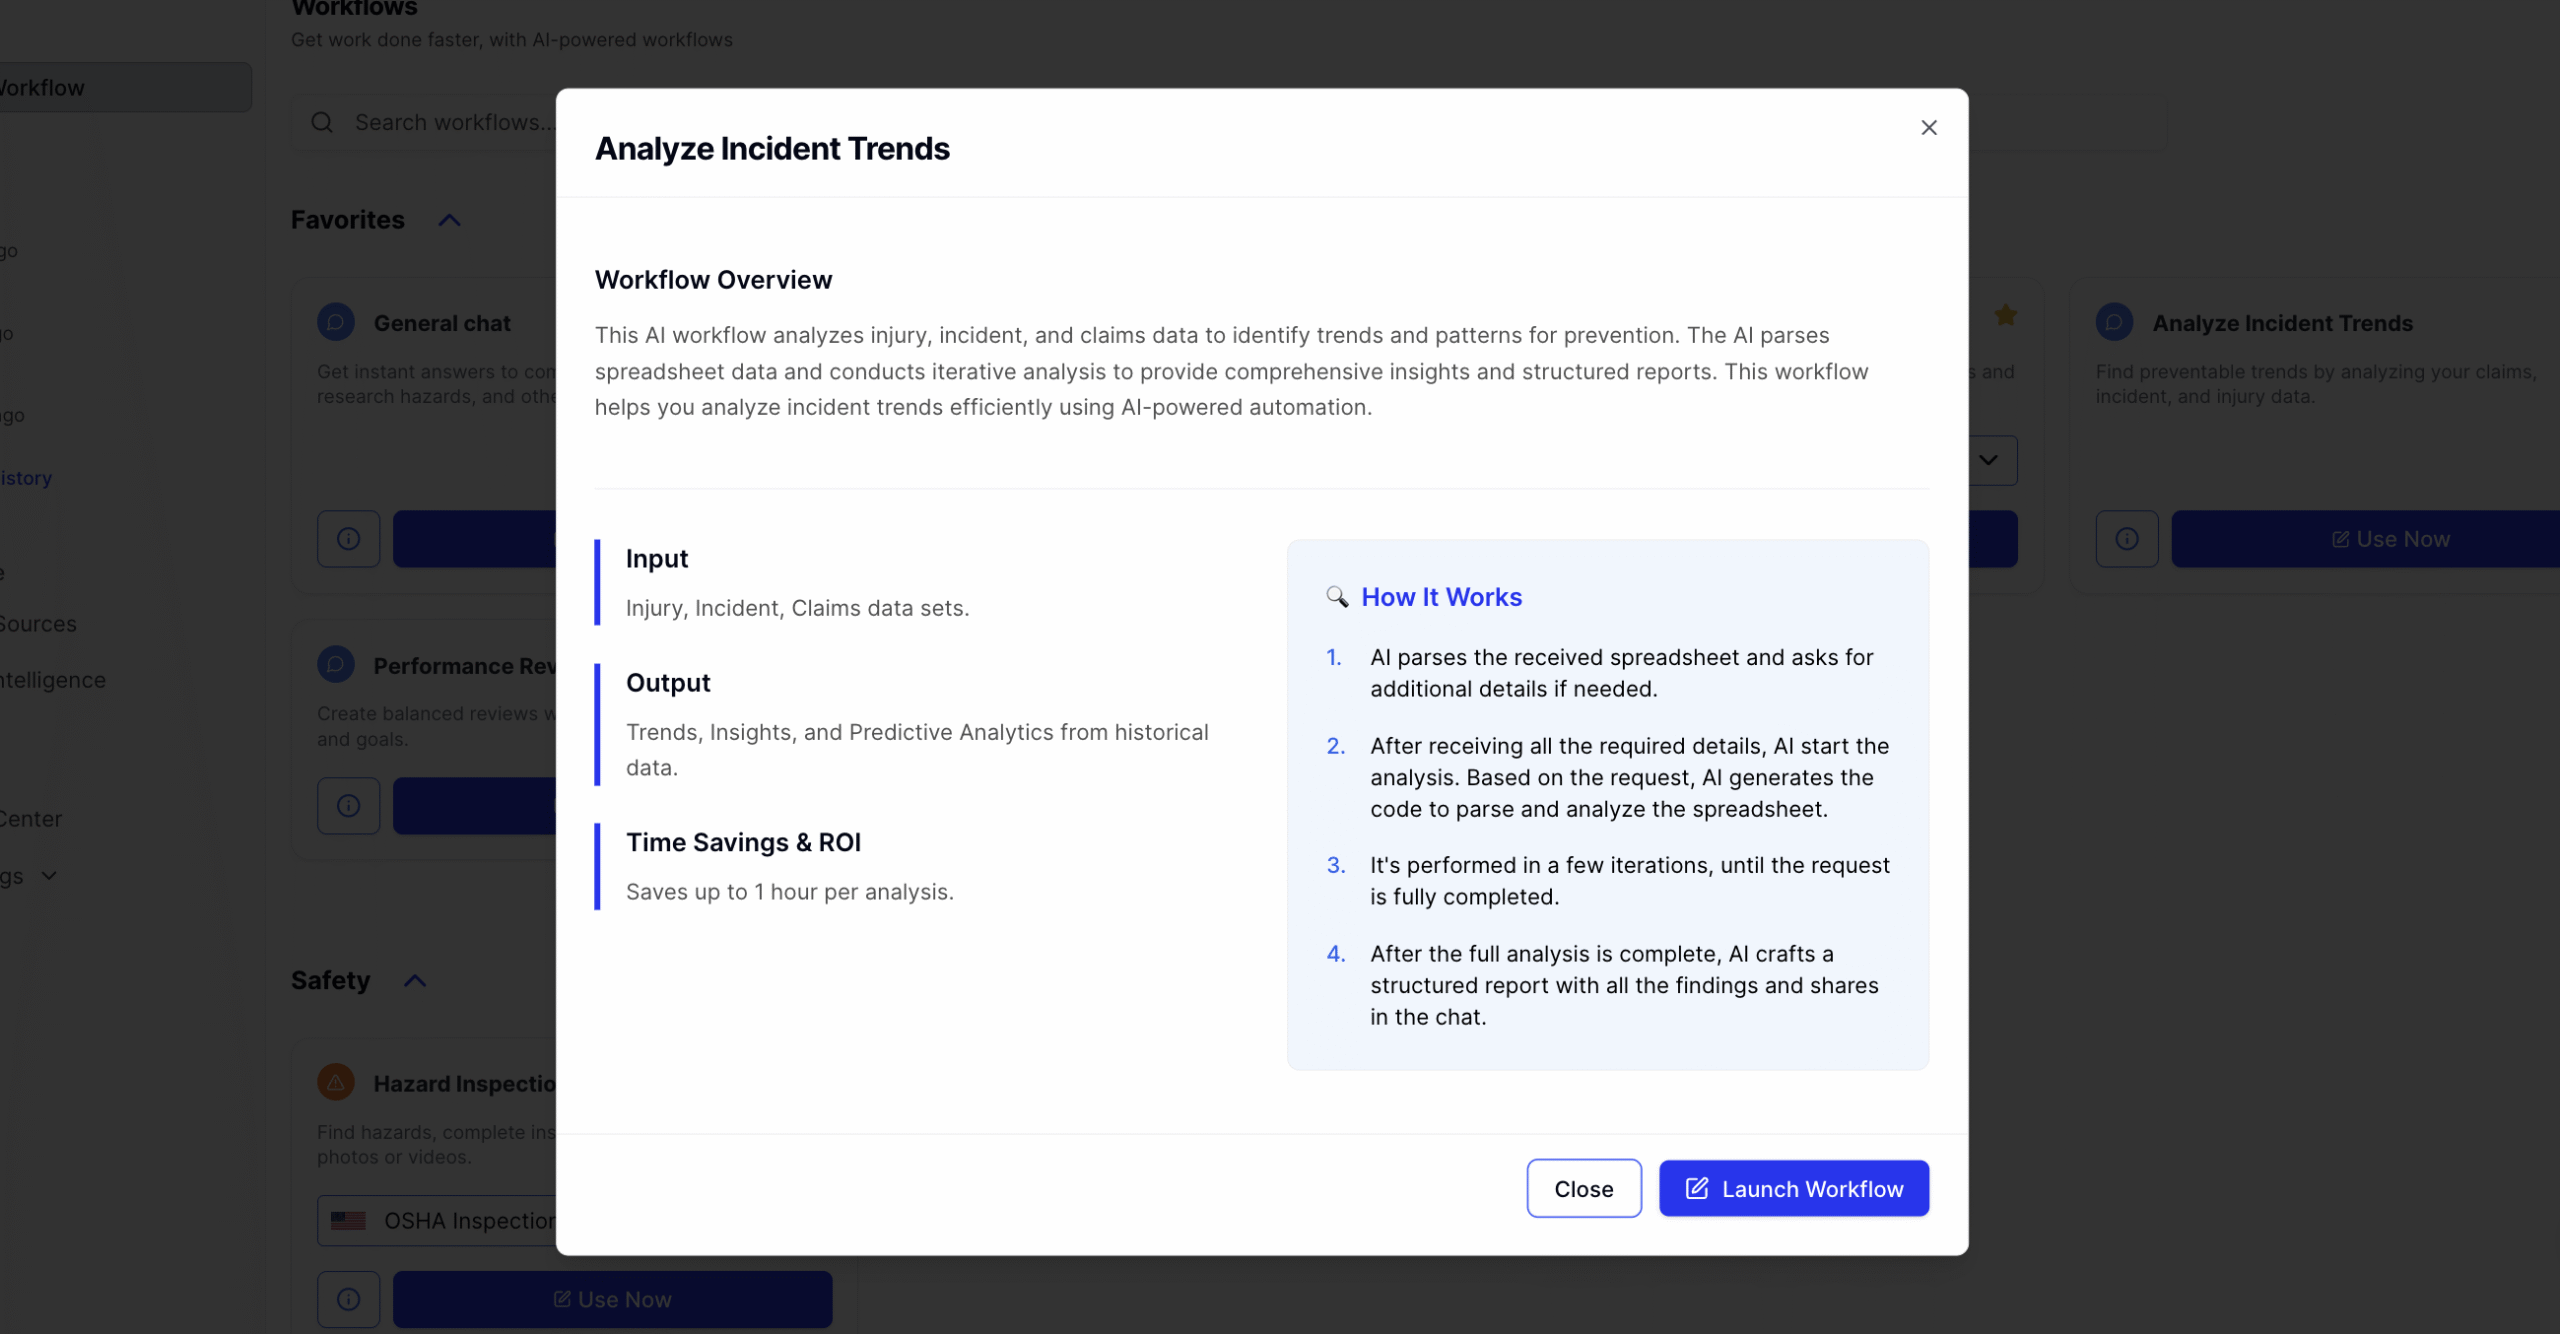
Find the workflow – Scroll down to the Data and Analytics group and select Analyze Incident Trends.
Upload your data – This could be incident, injury, claims, or any operational data file.
Answer quick prompts – SoterAI may ask clarifying questions (like frequency or context) to improve accuracy.
Generate your report – Click proceed, and SoterAI will begin creating charts, graphs, and insights.
What You’ll See
The incident trends analysis includes:
- 📊 Frequency by month – see spikes and patterns.
- 🏭 Distribution by location – compare sites at a glance.
- 🛠️ Leading incident types – understand where risks concentrate.
- 🔑 Keywords from descriptions – highlight recurring hazards.
- 💡 Key insights and recommendations – action items to reduce future risk.
Go Beyond the Standard Report
The real power of the Analyze Incident Trends workflow is flexibility:
- Ask for more detail – For example: “Add 100% more information about actionable insights today.”
- Chat with your data – Skip the report and just type questions into SoterAI.
- Convert outputs – Turn your findings into a PowerPoint or export a branded PDF/DOCX.
- Iterate in real time – Keep refining the analysis until it matches what you need.
Why It Matters
nstead of spending hours in Excel, you can:
- Spot leading risks before they escalate.
- Back up safety decisions with data-driven insights.
- Share audit-ready reports with leadership or clients.
With the Analyze Incident Trends workflow, you don’t just collect data—you turn it into action.
Get Started
Upload your first incident file today and let SoterAI’s Analyze Incident Trends workflow show you patterns, priorities, and improvements in minutes.
